Debt capital markets posted historical results in Q1 2021, boosted in large part by current market tailwinds such as further vaccination rollouts and expansionary fiscal policy. M&A and opportunistic issuance reached $73B and $108B, respectively, contributing to total institutional loan volumes of more than $180B over the period. As the possibility of a rising interest rate environment looms, investors have pivoted to floating-rate notes that contribute to a borrower-friendly environment on a loan supply basis.
Middle-market leveraged finance professionals representing leading credit funds, BDCs, finance companies, commercial banks and other credit providers were surveyed regarding attitudes toward the leveraged finance market. The data on the following pages reflects responses from the more than 60 leveraged finance professionals who participated in the survey from Q1 2021 (William Blair).
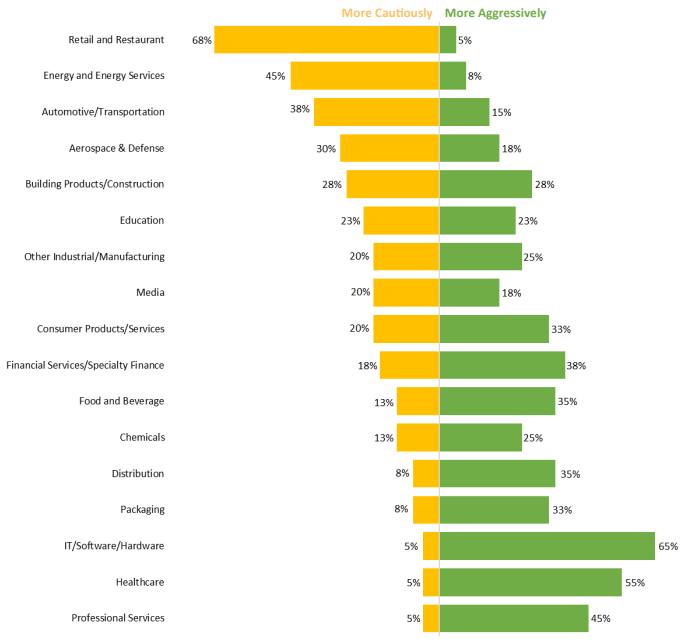
Are there any specific sectors or industries for which your firm is proceeding more aggressively or cautiously today compared with 6 months ago?
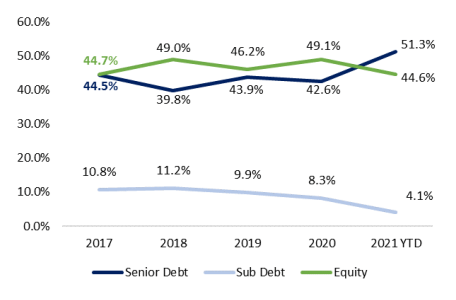
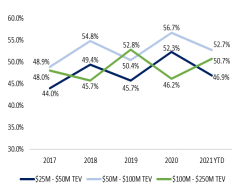
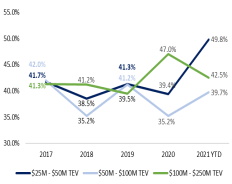
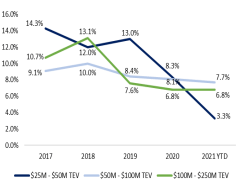
Valuation multiples have flatlined over Q1 2021 while debt utilization rates have proliferated. As leveraged markets continue to normalize, capital stack equity contributions in private equity transactions have fallen, now composing less than 45% of deal value. Further, subordinated debt has continued its downward path, composing less that 5% deal value, while senior debt contributions have broken through pre-COVID levels to account for nearly 50% of deal value. The following equity and debt breakdowns depict average capital structures across platform and add-on transactions.
Equity and Debt Contribution by Year
Equity Contribution by Year
Senior Debt Contribution by Year
Sub Debt Contribution by Year
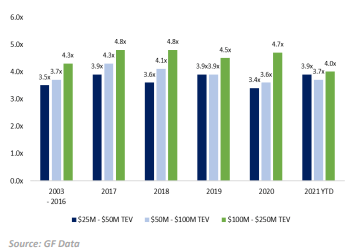
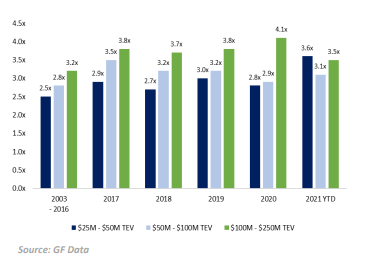
2021 YTD deal flow in the $25M – $50M range has experienced a full recovery to pre-COVID Total Debt-to-EBITDA multiples, while total Debt-to-EBITDA levels in the $50M – $100M and $100M – $250M TEV ranges are still off of their respective 2019 multiples. Senior Debt-to-EBITDA levels in the $25M – $50M TEV range YTD climbed 20% relative to 2019, while multiples in the $50M – $100M TEV range hover near its 2019 level. 2020 Senior Debt-to-EBITDA in the $100M – $250M TEV range reported its highest multiple on GF Data’s record, likely stemming from lenders’ flight to higher quality deals and more conservative capital stack positioning.
TOTAL Debt/EBITDA—All Industries by Deal Size
Senior Debt/EBITDA—All Industries by Deal Size
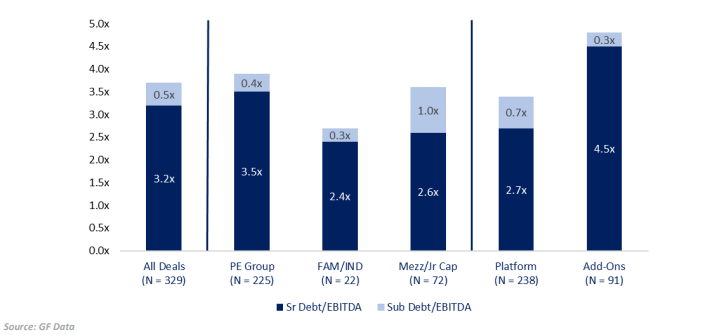
Leverage Multiples by Buyer Type and Seniority—2022/Q1 2021 Leverage Drilldown
As deal flow normalizes and COVID impact adjustments are made, lenders have provided guidance on current practices circumventing COVID-related adjustments to 2020 financials. Interestingly, if a business was affected by COVID but to a lesser degree, lenders in the current environment are not immediately willing to apply a revenue and/or EBITDA adjustment. For example, if revenue adjustments must be made, lenders prefer revenue addbacks where revenue deteriorations can clearly be attributed to shutdowns. Otherwise, lenders believe they would be handing out an unjustified “free pass”. Lenders are more comfortable giving credit for cost-related addbacks where a business incurred higher-than-normal costs to support the current course of operations as a result of COVID0 related impacts (e.g., heightened facility cleaning, PPE purchases, etc.).
For the remainder of 2021, what are your expectations regarding pricing of your primary debt offering?
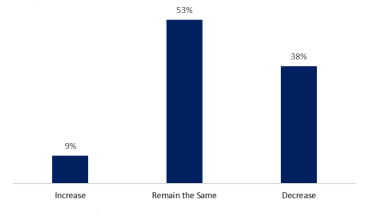
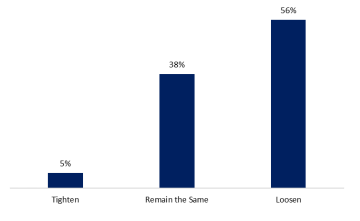
For the remainder of 2021, what are your expectations regarding transaction terms and leverage?